Introduction: From the Perfect CAD Model to a Costly Reality
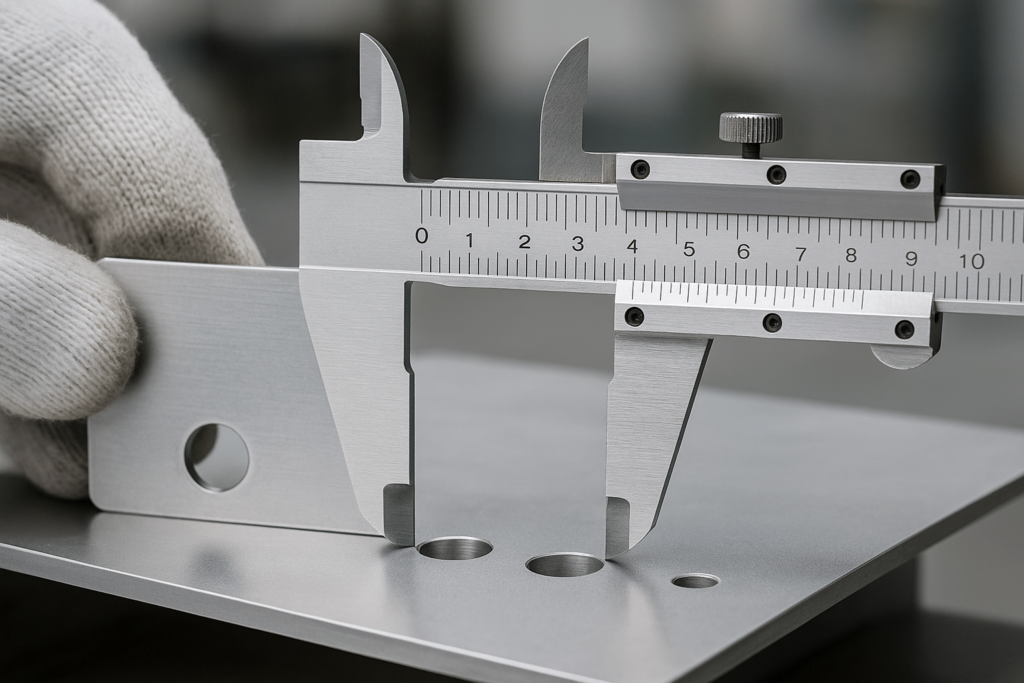
Every design looks perfect in CAD. The real challenge starts when that design enters production, where every cut, bend, hole, weld, and machined surface comes with variation. That is where tolerance stacking begins—and where many well-designed products quietly run into fit, function, and cost problems.
This is not just an engineering issue. For companies sourcing custom metal parts, tolerance stacking affects assembly reliability, scrap rate, rework, lead time, and total landed cost. A design that appears solid on screen can become expensive on the shop floor if dimensional variation is not managed early.
For overseas buyers especially, the risk is practical and immediate. A small oversight in tolerance planning can turn a shipment of precision parts into unusable stock. Whether you source sheet metal parts, CNC machined components, metal cabinets, display racks, or structural frames, understanding tolerance stacking is essential for better quality control and more predictable procurement.
What Is Tolerance Stacking and Why It Matters
Tolerance stacking is the combined effect of dimensional variation across multiple parts or features in an assembly. Even when each individual part is technically within tolerance, the total accumulated variation can still cause the final product to miss its required fit or function.
For engineers, that may mean interference, excessive clearance, misalignment, vibration, or premature wear. For buyers and sourcing teams, it often shows up as assembly failure, higher reject rates, delayed shipments, and unexpected cost increases.
Engineering vs. Commercial Impact
A fit that looks correct in a CAD model may fail in real production because stacked variation was underestimated. When that happens, the result is rarely limited to engineering rework. It often leads to scrap, assembly delays, warranty exposure, customer complaints, and margin loss.
Poor tolerance analysis is therefore not just a design problem. In B2B manufacturing, it is a commercial risk that affects both supplier performance and buyer confidence.
Business Risks of Ignoring Tolerance Analysis
Scrap and rework costs: Once a dimensional chain fails, correction is often expensive or impossible.
Line downtime: Poor fit during assembly can stop production unexpectedly.
Warranty and field risk: Long-term failures are often linked to unmanaged dimensional accumulation.
Supplier disputes: When tolerance responsibilities are unclear, quality issues quickly become commercial disputes.
Longer launch cycles: Prototype revisions and repeated sampling can delay mass production.
How to Identify the Tolerance Stack Path
A tolerance stack path, also called a dimensional chain, includes every feature that influences a critical requirement such as gap, alignment, hole position, parallelism, or assembly clearance. Identifying that path is the first step in controlling variation.
In metal fabrication, the chain may run through multiple processes, including laser cutting, bending, stamping, welding, CNC machining, and final assembly. If one important dimension is missed, the analysis can look correct on paper while still failing in production.
The Engineer’s Dilemma: Choosing Your Weapon—Certainty vs. Cost
Choosing a tolerance stack-up method is not just a technical decision. It is a direct choice between risk control and manufacturing cost. The method your supplier uses says a lot about how they think about quality, process stability, and commercial reality.
The two most common approaches—worst-case analysis and statistical analysis using RSS—reflect two very different ways of managing variation.
The Worst-Case Method: The Path of Absolute Certainty
Worst-case analysis is the most conservative method. It assumes that every dimension in the stack path reaches its least favorable tolerance limit at the same time and in the same direction. In simple terms, it asks: if every allowed variation works against us at once, will the assembly still function?
Because it uses absolute limits, worst-case analysis is the safest choice when 100% functional interchangeability is required. That is why it is commonly used in safety-critical or highly regulated applications, where a single failure is not acceptable.
The downside is cost. To satisfy worst-case requirements, engineers often tighten multiple part tolerances more than necessary. In production, that can mean higher machining cost, more difficult inspection, lower yield, and longer lead time.
The Statistical (RSS) Method: The Path of Economic Reality
Statistical tolerance analysis, usually based on the Root Sum Square (RSS) method, takes a more practical view. It assumes that variation tends to distribute around the nominal size and that it is highly unlikely for every part in an assembly to hit its worst limit in the same direction at the same time.
Instead of simply adding all tolerances together, the RSS method uses the square root of the sum of the squared tolerances. This usually produces a smaller total variation range than worst-case analysis and makes it possible to use more realistic and economical part tolerances.
That is why RSS is widely used in volume production, where a controlled and predictable process can support high yield at lower cost. But RSS only works well when the manufacturing process is stable, centered, and capable. If the supplier’s process control is weak, the math may look good while actual production results do not.
Buyer tip: When evaluating a supplier for precision metal parts, ask whether they use worst-case or RSS analysis, and ask for supporting Cp/Cpk data when the project depends on statistical control.
From Theory to the Shop Floor: Two Real-World Metal Fabrication Case Studies
Case studies make the concept easier to evaluate in real manufacturing conditions. For sourcing teams working with custom metal fabrication suppliers, these examples help show how tolerance decisions affect quality, cost, and production risk.
Case Study 1: The Simple Stack (Five Metal Disks)
To show the difference between the two methods, let us start with a simple stack of five metal disks. The goal is to calculate the possible total height range of the assembly.
| Component | Nominal Thickness (mm) | Bilateral Tolerance (mm) |
| Disk 1 | 15 | ±0.5 |
| Disk 2 | 10 | ±0.1 |
| Disk 3 | 15 | ±0.2 |
| Disk 4 | 12 | ±0.3 |
| Disk 5 | 15 | ±0.4 |
Worst-case calculation
Nominal stack height: 67 mm
Total worst-case tolerance: ±1.5 mm
Final assembly range: 65.5 mm to 68.5 mm
RSS calculation
TRSS = √(0.5² + 0.1² + 0.2² + 0.3² + 0.4²) ≈ ±0.742 mm
Final assembly range: 66.258 mm to 67.742 mm
The difference is important. If the finished product only needs a total stack tolerance of ±1 mm, the RSS method may allow more relaxed tolerances on individual components, which can lower machining cost and improve manufacturability.
Procurement takeaway: Buyers should not ask for unnecessarily tight tolerances on every single part. A better approach is to define the real functional requirement and then work backward with the supplier.

Case Study 2: The Complex 3D Fit (Axial Clearance in a Precision Gearbox)
A more realistic example is the axial clearance, or end float, of a shaft inside a precision gearbox. Here, the dimensional chain passes through housing faces, bearing seats, bearing elements, shaft shoulders, spacers, and mating interfaces.
This is no longer a simple linear stack. It also involves position, perpendicularity, concentricity, and other geometric controls that influence how the shaft actually runs inside the assembly.
Material choice adds another layer. If the housing is aluminum and the shaft is steel, the two materials expand at different rates under operating temperature. That thermal growth changes the final clearance and should be included in the tolerance study.
Buyer insight: When sourcing precision assemblies with multiple materials, ask whether the supplier’s tolerance analysis includes thermal drift, GD&T controls, and real assembly conditions. Many factories only calculate linear dimensions and miss the functional risks.
Common Pitfalls in Tolerance Analysis: Don’t Fall for These Traps
Even experienced teams make avoidable mistakes in tolerance analysis. Most problems do not come from a lack of formulas. They come from wrong assumptions, incomplete dimensional chains, or poor coordination between design and manufacturing.
Trap #1: Assuming Perfect Centering of Processes
Many designs assume that production variation stays centered on the nominal value. In real manufacturing, that is often not true. Tool wear, fixture shift, material springback, welding distortion, and setup drift can all move the process away from center.
When that happens, statistical methods such as RSS become less reliable unless the process is properly monitored.
Buyer tip: Ask for Cp/Cpk data on critical dimensions. If a supplier cannot demonstrate process capability, do not assume that a statistical tolerance model will hold in mass production.

Trap #2: Over-Tightening Tolerances Without Considering Cost
Tightening every dimension is not good engineering. It usually increases cost without improving performance. Very tight tolerances may require slower machining, more inspections, specialized tooling, or higher scrap rates, especially in metal fabrication and CNC work.
The better approach is to apply tight tolerances only where function truly depends on them.
Procurement note: Ask your supplier for DFM feedback and tolerance budget recommendations. In many cases, relaxing a non-critical dimension can reduce cost significantly without affecting assembly performance.
Trap #3: Ignoring Geometric Tolerances (GD&T)
Looking only at plus/minus dimensions is not enough. Many assembly failures are caused more by position error, flatness, perpendicularity, profile, or runout than by simple linear size variation.
This is why GD&T matters. A supplier that understands GD&T can often hold the dimensions that really affect function while avoiding unnecessary cost on dimensions that do not.
Sourcing tip: Ask whether your supplier supports GD&T-based design review, tolerance validation, and measurement planning.
Tools That Help You Win: GD&T, Digital Twin, and Closed-Loop Feedback
Modern manufacturing teams do not rely on basic math alone. They use tools that connect design intent, simulation, process control, and inspection data.
GD&T (Geometric Dimensioning & Tolerancing)
GD&T defines not only how much a feature can vary, but also how that feature may vary in position, orientation, and relationship to datums. It is one of the most effective ways to control real assembly behavior in three dimensions.
Using GD&T properly can improve functional control while still keeping the design manufacturable.
Supplier qualification tip: A manufacturer that can read and apply datum structures, true position, MMC, and profile controls is usually better prepared to manage tolerance risk during both prototyping and production.
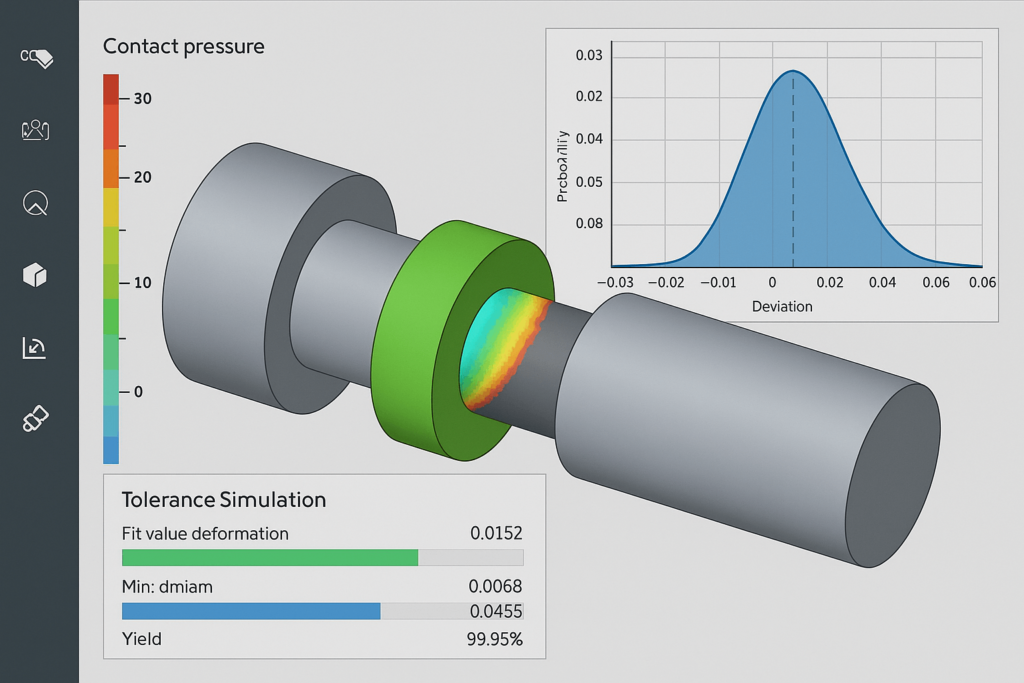
Digital Twin Analysis
Digital twin analysis allows engineers to simulate how variation across all relevant parts affects the final assembly. By testing many virtual build conditions in advance, teams can identify weak points before production starts.
This is especially useful for complex sheet metal assemblies, machined housings, welded structures, and mixed-process products, where tolerance interaction is difficult to judge manually.
Closed-Loop Manufacturing
Closed-loop manufacturing uses inspection feedback from tools such as CMMs, gauges, scanners, or in-process measurement systems to adjust production in real time or across repeated batches.
This helps reduce variation, improve consistency, and build better traceability over time.
B2B advantage: For overseas sourcing projects, closed-loop control gives buyers stronger confidence because production quality is supported by measurable data, not just verbal claims.
Final Thoughts: Tolerance Management Is Strategic Procurement
In global manufacturing, tolerance management is no longer just an engineering detail. It is a procurement strategy. Buyers who understand how variation accumulates can make better decisions on supplier selection, DFM review, pricing, quality planning, and production risk.
Whether the project involves sheet metal enclosures, CNC machined parts, welded frames, metal cabinets, display racks, or custom OEM assemblies, a sound tolerance strategy helps reduce scrap, improve yield, and shorten the path to stable production.
At Yishang Metal Products Co., Ltd., we support OEM and ODM customers with practical manufacturing input based on 26+ years of experience in sheet metal parts, metal cabinets, metal display racks, and custom metal fabrication. We work with materials such as stainless steel 304/316, low carbon steel, galvanized steel, aluminum, copper, and brass, and we support processes including laser cutting, bending, deep drawing, stamping, welding, CNC machining, surface finishing, assembly, packaging, inspection, and shipment.
For buyers who need durable, long-life metal products at competitive wholesale pricing, tolerance review should start before production—not after a problem appears in assembly.
📌 Ready to Stop Guessing and Start Controlling Your Tolerance Stack?
- Talk with our engineering team about your dimensional chain, fit, and assembly risk.
- Send your drawings or CAD files for a manufacturability review.
- Work with a wholesale custom metal manufacturer that understands both engineering control and sourcing reality.