The Myth of “The Lower the Better”
When sourcing sheet metal components, many overseas buyers prioritize a low coefficient of friction (μ), assuming it automatically guarantees smoother operations, fewer defects, and lower production costs. This mindset is widespread but oversimplified—and often counterproductive.
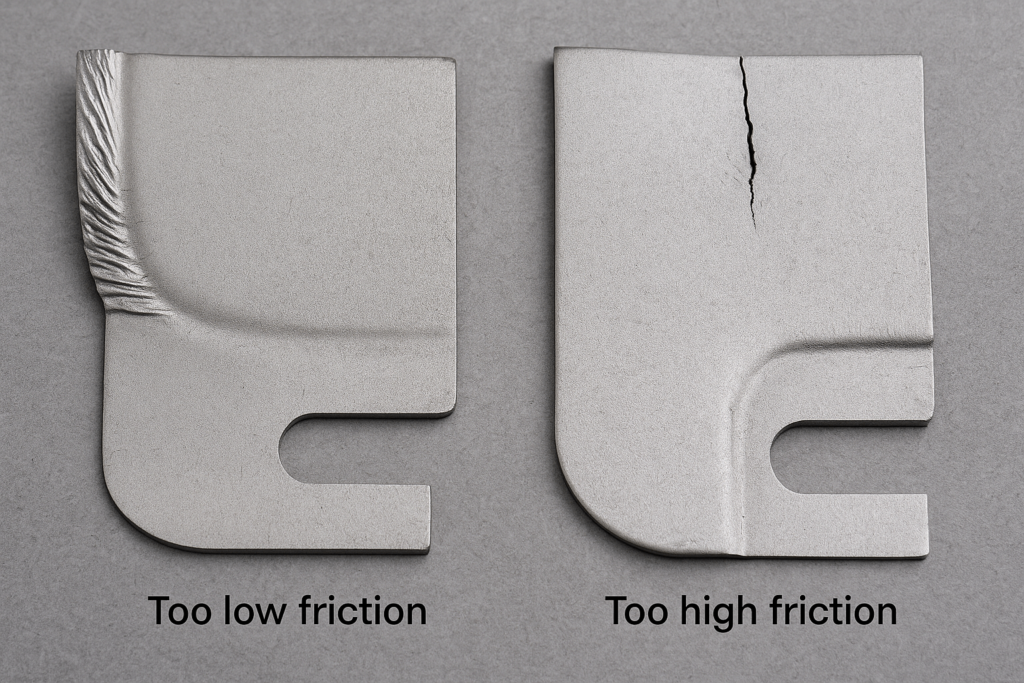
In reality, friction behaves like a balancing variable, not a fixed target. Too low a μ can destabilize forming processes, leading to sheet slippage, dimensional drift, or poor die control during bending and drawing. For example, excessive lubrication may prevent stainless steel from properly gripping the die, causing wrinkling or distortion. Conversely, when μ is too high, galling, tool wear, and thermal buildup may occur, driving up maintenance costs.
Understanding this nuance helps buyers move from a “spec-driven” mindset to a process-performance mindset. The key question is not “how low can μ go?” but “what μ range ensures consistent forming and cost stability for this material and geometry?”
At YISHANG, we’ve seen that successful long-term suppliers align μ with material grade, surface finish, and forming pressure. Rather than chasing an arbitrary low value, they build data-informed process windows—helping overseas buyers achieve repeatable results and stable cost per unit across different production environments.
➡️ Why this matters: Friction management is not a lab experiment; it’s a production control parameter that directly shapes your total cost of ownership, product consistency, and supply reliability.
2. Why Friction Management Isn’t One-Size-Fits-All
Managing friction in sheet metal fabrication is rarely a linear task. What appears to be a simple coefficient often involves multiple teams, tools, and trade-offs. From simulation engineers to production operators, each stakeholder interprets friction differently—and that’s where inconsistency begins.
2.1 Conflicting Priorities in Manufacturing Teams
Friction control requires collaboration across disciplines:
- Process Engineers want stable sheet flow and minimal surface defects.
- CAE Analysts depend on accurate μ inputs to simulate real forming conditions.
- Tooling Engineers prioritize consistent grip and predictable wear along die radii.
- Procurement Teams must justify lubrication budgets and maintenance intervals.
These priorities often collide. For example, analysts may request a low μ for simulation ease, while tooling engineers prefer a higher μ for grip. Meanwhile, finance teams cutting lubrication costs can unintentionally trigger galling or elevated scrap rates.
2.2 System-Level Friction Management
Forward-thinking manufacturers treat μ as a system property, not an isolated metric. Effective friction management integrates three layers:
- Design-Level – selecting coating, texture, and die finish based on target μ.
- Process-Level – adjusting forming speed, pressure, and lubrication dynamically.
- Validation-Level – verifying μ through continuous testing and sensor data.
When these layers interact, forming becomes predictive—not reactive. The goal is to build closed-loop control systems that sustain forming stability and reduce downtime.
2.3 What This Means for Buyers
As a B2B procurement manager, your focus should shift from “what μ number to specify” to “how your supplier manages μ.” During supplier audits or RFQ reviews, ask:
- How is μ measured and controlled throughout shifts?
- Do simulations align with actual press performance?
- Is μ validated via dynamic testing or static lab results only?
✅ Buyer’s Tip: Vendors who treat μ as a monitored, evolving parameter deliver better quality consistency, lower rejection rates, and predictable lead times.
➡️ Transition: This holistic understanding sets the stage for the next challenge—how static friction data often fails to represent the realities of sheet metal forming.
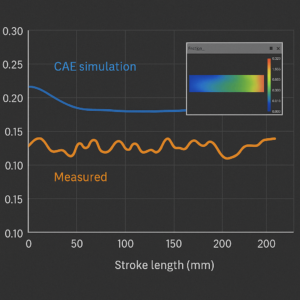
3. The Gap Between Static COF and Real-World Conditions
Static coefficient of friction (COF) tables—like “aluminum lubricated: 0.10” or “stainless dry: 0.18”—give a sense of certainty that rarely exists in practice. Friction in actual sheet metal forming is dynamic, influenced by temperature, pressure, and lubricant breakdown.
3.1 Why Static Data Misleads Buyers
Static μ assumes forming conditions remain constant. In production:
- Lubricant film rupture can double μ mid-stroke.
- Thermal expansion alters surface contact pressure.
- Surface finish variability introduces random spikes.
A μ = 0.12 simulation might predict flawless forming—but at +30°C, it can rise to 0.25, causing tearing and downtime. For buyers, this means hidden cost escalation and scheduling risks.
🎯 Procurement Insight: Always ask how suppliers translate lab μ into real-world validation. Data without context equals uncertainty.
3.2 Reducing the Simulation–Production Gap
Leading suppliers use μ calibration trials—testing under realistic loads, speeds, and lubrication—to align simulation with production. They also include temperature- and pressure-dependent μ curves, ensuring digital twins match physical forming.
3.3 Turning Friction Data into a Quality Metric
Suppliers that correlate μ data to KPIs—like die life and rejection rate—offer measurable reliability. For buyers, this transparency transforms friction from a variable into a quality assurance tool.
✅ Buyer’s Tip: Request ASTM- or ISO-based μ protocols (pin-on-disk or strip draw). Empirical validation defines supplier credibility.
➡️ Transition: Understanding real-world μ behavior is just one part—the next step is recognizing how friction evolves during each forming stroke.
4. Friction Changes During the Stroke: Why It Matters
Even with stable forming parameters, friction changes throughout the stroke. Heat, pressure, and lubricant thinning reshape μ dynamically, influencing form accuracy and tool life.
4.1 How Friction Evolves During Forming
- Early stroke: μ remains low with fresh lubrication.
- Mid-stroke: localized heating and adhesion elevate μ.
- End stroke: pressure stabilizes; μ may decrease slightly.
Such changes affect wall thickness, alignment, and surface finish. Without dynamic friction monitoring, variability between production batches can rise sharply.
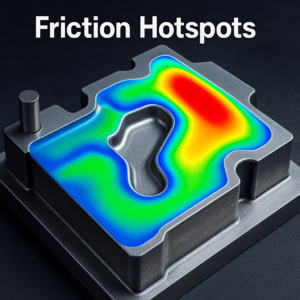
4.2 Detecting Friction Hotspots
High μ zones—blank holders, die radii, and sidewalls—create local wear and uneven pressure. Modern forming uses μ mapping and surface texture optimization to locate and manage these areas.
4.3 Supplier Control Techniques
Advanced plants deploy micro-lubrication systems, textured dies, and controlled Ra surfaces to maintain μ stability. These reduce maintenance and improve energy efficiency—directly impacting procurement ROI.
🧠 Buyer’s Takeaway: Treat friction as a moving parameter. Suppliers who track and manage μ variation ensure dimensional repeatability and long-term cost efficiency.
➡️ Transition: Beyond the process layer, buyers must also account for how friction contributes to the unseen financial side of production.
5. The Hidden Cost of Friction: A Procurement Risk
Friction doesn’t just affect formability—it shapes tool longevity, energy use, and yield efficiency. Ignoring it can inflate total cost of ownership (TCO) even when part pricing seems competitive.
5.1 Understanding the Cost Equation
| Cost Factor | High μ (0.40) | Low μ (0.12) |
|---|---|---|
| Tool wear | Increased | Reduced |
| Lubricant use | Reduced | Increased |
| Energy use | Higher | Lower |
| Misfeed risk | Lower | Higher |
| Forming consistency | Better | Variable |
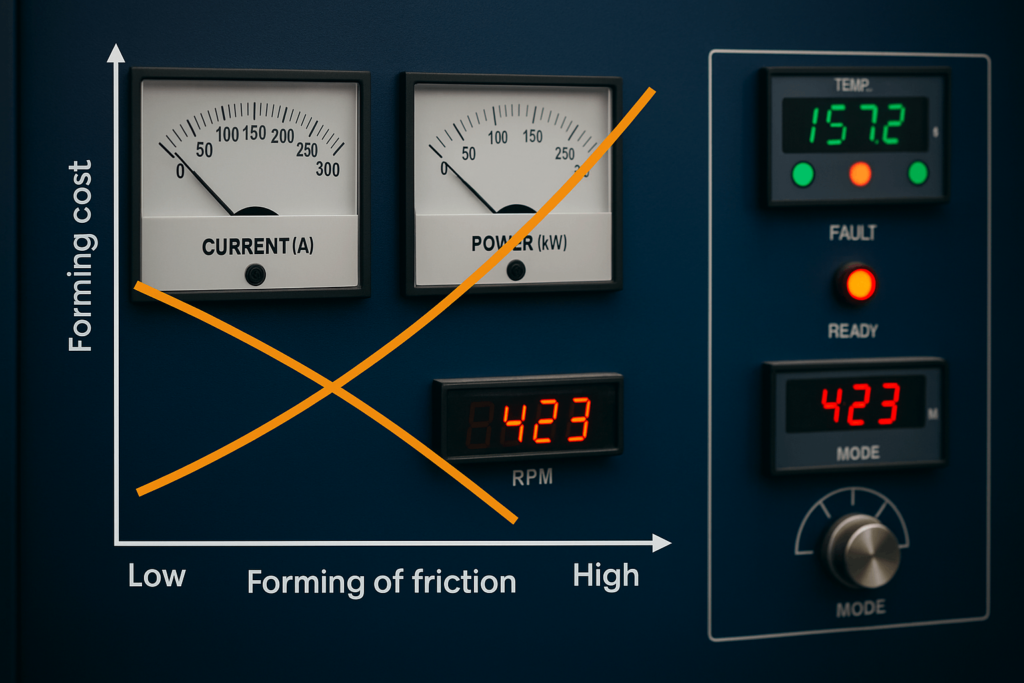
Low μ saves energy but risks instability. High μ consumes power yet enhances control—critical for deep-draw or asymmetrical geometries.
5.2 The Procurement Trade-Off
Over-lubrication may seem cost-saving but adds cleaning and environmental costs. Poor surface finish or inconsistent μ increases tool rework frequency. Smart procurement aligns μ control with TCO tracking.
5.3 Turning Friction into a Financial KPI
Modern suppliers measure μ over time—monitoring stability, energy variation, and die life. Procurement teams using this data gain a predictive advantage.
🧾 Buyer’s Checklist:
- Request μ lifecycle data (strokes vs μ trend).
- Review energy use modeling tied to μ variation.
- Compare total cost between μ regimes.
💡 Buyer’s Takeaway: Assess friction as part of your process economics. Suppliers mastering μ stability offer both precision and measurable financial value.
➡️ Transition: Evaluating friction data critically is essential—let’s explore how to interpret supplier μ claims responsibly.
6. Supplier Friction Data: Don’t Take It at Face Value
Many datasheets quote μ values like “steel dry: 0.4–0.6” or “aluminum lubricated: 0.1–0.25.” Without context, they mislead. Real μ depends on tooling wear, lubrication condition, and batch variability.
6.1 Why Generic μ Misleads Buyers
Suppliers may use textbook data or limited trials. But real production μ fluctuates with temperature, pressure, and wear. A quoted 0.20 μ can become 0.28 under high-speed forming.
🎯 Procurement Insight: Always request testing context—pressure, temperature, and lubricant type—before trusting μ claims.
How to Verify Supplier Data
- Ask for μ test curves under representative conditions.
- Confirm lubricant–tool interaction analysis.
- Review batch consistency metrics for μ stability.
Embedding Friction Accountability
Require μ measurement protocols in supplier audits and align them with ASTM G99 or ISO 15113 standards. This ensures empirical, traceable data.
📌 Buyer’s Takeaway: Friction data is not marketing—it’s engineering. Suppliers sharing validated μ data demonstrate maturity and transparency.
➡️ Transition: Once μ is validated, leading manufacturers take the next step—using friction as a predictive control metric.
Using μ as a Predictive Quality Control Parameter
Friction (μ) has evolved from a passive measurement into a predictive process control variable. Managed well, it warns of wear, lubrication failure, and dimensional drift long before defects emerge.
From Reactive Correction to Predictive Control
Instead of post-defect reaction, smart plants use sensors—pressure, temperature, vibration—to correlate μ behavior with part quality. This data loop supports real-time adjustments and precision forming.
Adaptive Lubrication and Automation
Real-time μ data powers adaptive lubrication systems, automatically adjusting feed or press speed. It reduces waste, stabilizes forming, and ensures consistent accuracy—ideal for large-scale fabrication contracts.
Friction as a Supplier Benchmark
Buyers should evaluate suppliers by μ stability, auto-correction capability, and correlation with Cpk or defect rate.
📊 Buyer’s Takeaway: μ control defines process maturity. Suppliers providing μ monitoring data offer confidence in repeatability and scalability.
📈 YISHANG’s Note: Our lines feature closed-loop μ control and real-time data tracking, ensuring consistency across global production runs.
➡️ Transition: With friction measurable and manageable, the final step is to make it part of your sourcing standards.
Make μ Part of Your Specification
RFQs often detail strength, coating, and tolerance—but skip μ. Including friction in specs turns assumptions into data-backed agreements.
Why Friction Belongs in Specifications
Clear μ parameters align simulation, tooling, and lubrication strategies. They eliminate costly forming trials and standardize testing across suppliers.
How to Specify μ
Define a μ range (not a fixed number):
- Stainless (lubricated): 0.15–0.25
- Aluminum (dry): 0.35–0.50
Request testing methods, lubrication details, and condition parameters. Consistent methodology > low value.
Friction-Informed RFQ Framework
Add μ compliance into FAI, KPI scorecards, and vendor qualification. This embeds accountability across the supply chain.
💡 Buyer’s Takeaway: Making μ part of specifications transforms it into a quality benchmark. Vendors embracing μ control deliver predictability and process discipline.
📈 YISHANG’s Insight: We collaborate with clients to co-define μ-based forming windows for smoother startup and uniform global output.
➡️ Transition: For clarity, let’s address the top sourcing questions about μ in sheet metal fabrication.
FAQs for Sourcing Teams
Is a Lower μ Always Better?
No. Optimal μ balances stability and efficiency. Too low risks slippage; too high raises wear. Evaluate μ contextually with material, geometry, and lubrication.
How Does μ Affect TCO?
Fluctuating μ alters tool wear, energy use, and rejection rates. Consistent μ = predictable costs.
How to Verify Supplier μ Data?
Request μ test results, correlation data, and standard references (ASTM, ISO). Empirical proof > assumption.
Does μ Stay Constant?
No. μ evolves dynamically. Suppliers using in-press monitoring maintain higher stability.
Should μ Be in Specifications?
Absolutely. Including μ reduces trial error and aligns supplier performance.
📩 Looking to stabilize cost and forming consistency? Partner with YISHANG—your custom fabrication partner combining data-driven friction management with 26 years of metal forming expertise.